Multiple Choice
Figure 21-1.The figure shows three indifference curves and a budget constraint for a certain consumer named Jack. 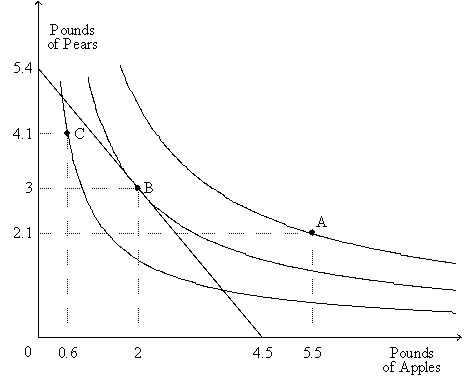
-Refer to Figure 21-1.About what percentage of his income is Jack spending on apples when he is at his optimum?
A) 33.3 percent
B) 38.2 percent
C) 44.4 percent
D) 56.7 percent
Correct Answer:

Verified
Correct Answer:
Verified
Q3: Explain the relationship between the budget constraint
Q27: The rate at which a consumer is
Q32: Assume that a college student purchases only
Q42: Economic studies of lottery winners and people
Q62: If an indifference curve is bowed out
Q125: The substitution effect of a price change
Q183: Figure 21-1.The figure shows three indifference curves
Q201: A family on a trip budgets $800
Q243: An inferior good is one in which<br>A)the
Q428: An indifference curve illustrates the<br>A)prices facing a