Short Answer
Figure 21-2.The graph shows two budget constraints for a consumer. 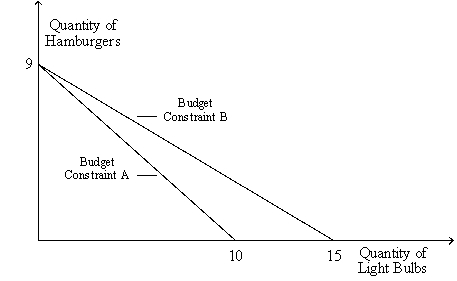
-Refer to Figure 21-2.Suppose the consumer's income is $90 and Budget Constraint A applies.What is the price of a light bulb?
Correct Answer:

Verified
The price ...View Answer
Unlock this answer now
Get Access to more Verified Answers free of charge
Correct Answer:
Verified
View Answer
Unlock this answer now
Get Access to more Verified Answers free of charge
Q12: Indifference curves tend to be bowed inward
Q27: Figure 21-8 <img src="https://d2lvgg3v3hfg70.cloudfront.net/TB1273/.jpg" alt="Figure 21-8
Q181: A rise in the interest rate will
Q195: A set of indifference curves that are
Q243: Figure 21-16<br> <img src="https://d2lvgg3v3hfg70.cloudfront.net/TB2185/.jpg" alt="Figure 21-16
Q284: Pepsi and pizza are normal goods. When
Q435: Figure 21-8 <img src="https://d2lvgg3v3hfg70.cloudfront.net/TB1273/.jpg" alt="Figure 21-8
Q458: Figure 21-2<br> <img src="https://d2lvgg3v3hfg70.cloudfront.net/TB2185/.jpg" alt="Figure 21-2
Q512: When two goods are perfect substitutes, the
Q525: Given a consumer's indifference map, the demand