Multiple Choice
Figure 21-3. 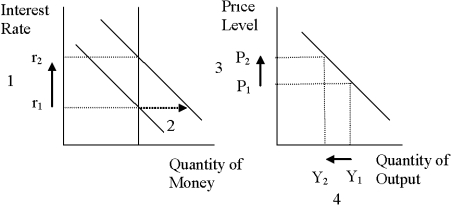
-Refer to Figure 21-3. What quantity is represented by the vertical line on the left-hand graph?
A) the supply of money
B) the demand for money
C) the rate of inflation
D) the quantity of bonds that was most recently sold or purchased by the Federal Reserve
Correct Answer:

Verified
Correct Answer:
Verified
Related Questions
Q3: Suppose aggregate demand shifts to the left
Q34: Which among the following assets is the
Q42: The multiplier effect is exemplified by the
Q49: In the short run,an increase in the
Q100: The interest rate would fall and the
Q114: Other things the same,as the price level
Q144: For the U.S.economy,which of the following is
Q148: In which of the following cases would
Q349: A decrease in the interest rate could
Q350: Figure 21-2. On the left-hand graph, MS