Multiple Choice
Figure 21-4. On the figure, MS represents money supply and MD represents money demand. 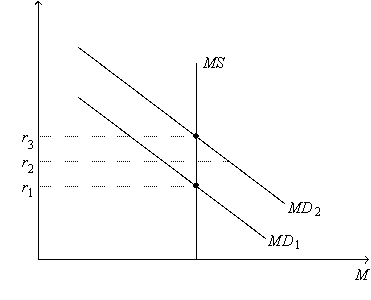
-Refer to Figure 21-4. Which of the following events could explain a shift of the money-demand curve from MD1 to MD2?
A) a decrease in the price level
B) a decrease in the cost of borrowing
C) an increase in the price level
D) an increase in the cost of borrowing
Correct Answer:

Verified
Correct Answer:
Verified
Q11: Which of the following policy actions shifts
Q26: Paul Samuelson, a famous economist, said that<br>A)"the
Q33: According to liquidity preference theory,<br>A)an increase in
Q65: Suppose investment spending falls.To offset the change
Q65: An increase in government spending on goods
Q66: Most economists believe that fiscal policy<br>A)only affects
Q73: An increase in the MPC<br>A)increases the multiplier,so
Q76: Liquidity preference refers directly to Keynes' theory
Q160: Which of the following sequences best
Q162: In a certain economy, when income is