Essay
Consider the table below with information regarding each activity, immediate predecessors, and duration estimates (in minutes) for each activity. 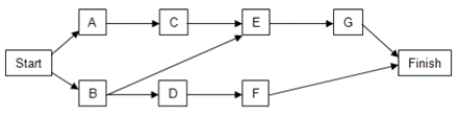
a. Using the PERT distribution in ASP to represent the duration of each activity, construct a simulation model to compute the total time to complete the task.
b. What is the expected duration of the entire project? What is the standard deviation of the project duration?
c. What is the likelihood that the project will be complete in 26 minutes?
Correct Answer:

Verified
a. Refer to the screenshot below for the...View Answer
Unlock this answer now
Get Access to more Verified Answers free of charge
Correct Answer:
Verified
View Answer
Unlock this answer now
Get Access to more Verified Answers free of charge
Q4: _ is the process of determining that
Q15: The weekly demand for an item in
Q17: Which of the following is true of
Q28: In a _, a random variable can
Q29: A specialty hedge fund is considering
Q30: The range of computer-generated random numbers is<br>A)[-8,
Q34: A toy company designs a new toy
Q35: Which of the following inferences about a
Q37: In reviewing the graph below, which of
Q41: A distribution of a random variable for