Multiple Choice
Using the graph below, the feasible region for the function represented in the graph is 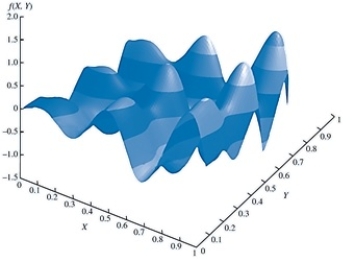
A) -1 £ X £ 1, -1 £ Y £ 1.
B) -1.5 £ X £ 1, 0 £ Y £ 8.
C) -1.5 £ X £ 2.0, -1.5 £ Y £ 2.0.
D) 0 £ X £ 1, 0 £ Y £ 1.
Correct Answer:

Verified
Correct Answer:
Verified
Related Questions
Q5: If there are no other feasible points
Q12: In the Bass forecasting model, parameter m<br>A)measures
Q23: One of the ways to formulate the
Q29: In a nonlinear problem, the rate of
Q30: Consider the stock return data given
Q33: In reviewing the image below, the point
Q34: A feasible solution is a(n) _ if
Q36: A portfolio optimization model used to construct
Q37: Gatson manufacturing company is willing to promote
Q38: A feasible solution is _ if there