Multiple Choice
A time series plot of a period of time (in years) verses sales (in thousands of dollars) is shown below Which of the following data patterns best describes the scenario shown? 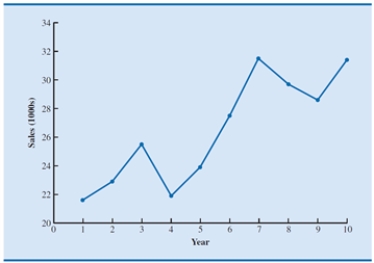
A) Linear trend pattern
B) Nonlinear trend pattern
C) Seasonal pattern
D) Cyclical pattern
Correct Answer:

Verified
Correct Answer:
Verified
Related Questions
Q9: Which of the following is not present
Q14: Which of the following is true of
Q20: If a time series plot exhibits a
Q22: Which of the following is not true
Q24: The monthly sales (in hundreds of
Q26: The following data shows the quarterly
Q28: A positive forecast error indicates that the
Q32: Causal models<br>A)provide evidence of a causal relationship
Q33: The following times series shows the
Q35: Using a large value for order k