Multiple Choice
A time series plot of a period of time period (quarterly) verses quarterly sales (in $1,000s) is shown below. Which of the following data patterns best describes the scenario shown? 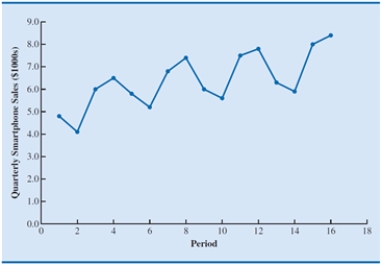
A) Linear trend and cyclical pattern
B) Linear trend and horizontal pattern
C) Seasonal and cyclical patterns
D) Seasonal pattern and linear trend
Correct Answer:

Verified
Correct Answer:
Verified
Q3: A set of observations on a variable
Q9: _ is the amount by which the
Q10: Autoregressive models<br>A)use the average of the most
Q11: With reference to time series data patterns,
Q29: The moving averages method refers to a
Q31: The mean absolute error, mean squared error,
Q48: The yearly sales (in millions of
Q49: The process of _ might be used
Q53: A time series plot of a period
Q57: Suppose for a particular week, the forecasted