Multiple Choice
The scatter chart below displays the residuals verses the dependent variable, x. Which of the following conclusions can be drawn based upon this scatter chart? 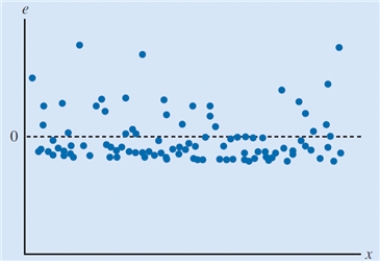
A) The residuals have a constant variance.
B) The model captures the relationship between the variables accurately.
C) The model underpredicts the value of the dependent variable for intermediate values of the independent variable.
D) The residual distribution is not normally distributed.
Correct Answer:

Verified
Correct Answer:
Verified
Q2: The _ is a measure of the
Q3: _ refers to the use of sample
Q6: The multiple regression model represents pricing for
Q7: The degree of correlation among independent variables
Q8: The multiple regression model represents pricing for
Q20: The prespecified value of the independent variable
Q22: Assessing the regression model on data other
Q34: The graph of the simple linear regression
Q44: A procedure for using sample data to
Q45: The least squares regression line minimizes the