Multiple Choice
Consider the clustered bar chart of the dashboard developed to monitor the performance of a call center: 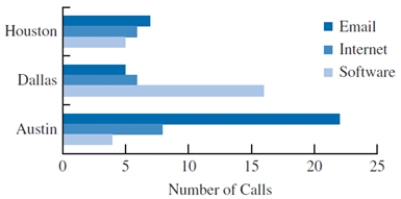 This chart allows the IT manager to
A) identify a particular type of problem by the call volume.
B) identify a particular type of problem by location.
C) identify different types of problems (Email, Internet, or Software) in the call center.
D) identify the frequency of each problem in the call center.
Correct Answer:

Verified
Correct Answer:
Verified
Q4: A _ is useful for visualizing hierarchical
Q13: A line chart that has no axes
Q21: The charts that are helpful in making
Q27: Consider the following survey results regarding
Q27: To summarize and analyze data with both
Q29: The following table shows the average
Q31: The ratio of the amount of ink
Q34: A survey on the average pass
Q39: The software package most commonly used for
Q47: Fields may be chosen to represent all