Multiple Choice
Which graph represents a negative linear relationship between x and y? 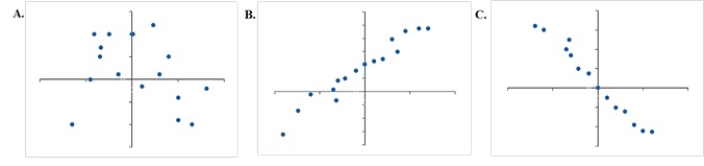
A) A
B) B
C) C
D) None of the graphs display a negative linear relationship.
Correct Answer:

Verified
Correct Answer:
Verified
Related Questions
Q10: Suppose that you make a fixed
Q11: What is(are) the mode(s) of the following
Q11: The data collected from the customers in
Q13: Any data value with a z-score less
Q15: The partial relative frequency distribution is
Q16: Which of the following graphs provides information
Q16: The Excel function STANDARDIZE can be used
Q37: Which of the following are necessary to
Q40: If covariance between two variables is near
Q50: The College Board originally scaled SAT scores