Multiple Choice
Given the following graphs, which graph represents fixed costs?
I 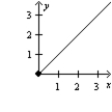 II
II 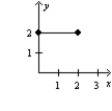 III
III 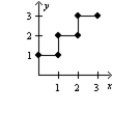
A) I
B) II
C) III
D) none of these
Correct Answer:

Verified
Correct Answer:
Verified
Related Questions
Q34: Managerial judgement includes the possibility of mixed
Q35: _ result when organizations acquire many multiperiod
Q36: Before opting to use managerial judgment, management
Q37: Activity-based use of resources can improve both
Q38: The following information was taken from
Q40: Resources are categorized as flexible, which are
Q41: Which of the following methods of determining
Q42: Committed resources<br>A)are supplied as needed.<br>B)are acquired by
Q43: Costs in marketing, distribution, and service after
Q44: The experience curve relates cost to increased