Multiple Choice
The following diagram is a cost-volume-profit graph for a manufacturing company: 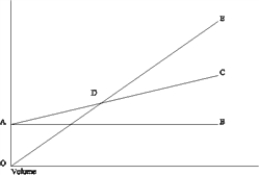 Select the answer that best describes the labeled item on the diagram.
A) Area CDE represents the area of net loss.
B) Line AC graphs total fixed costs.
C) Point D represents the point at which the contribution margin per unit increases.
D) Line AC graphs total costs.
Correct Answer:

Verified
Correct Answer:
Verified
Q1: The cost-volume-profit graph portrays the relationship between
Q4: Income taxes are generally calculated as a
Q5: A very high degree of operating leverage
Q6: Uncertainty regarding costs, prices, and sales mix
Q7: Units to earn target profit equal total
Q8: Tiramisu Company projected the following information
Q9: Assuming all other things are the same,
Q10: In 2018, Samantha's Bath and Body Shop
Q11: Nonesuch Company sells only one product at
Q24: When a company sells more units than