Multiple Choice
The following diagram is a cost-volume-profit graph for a manufacturing company: 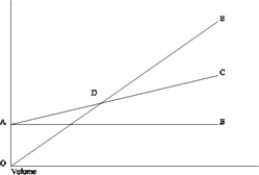 The difference between line AB and line AC (area BAC) is the
A) contribution ratio.
B) total variable cost.
C) contribution margin per unit.
D) total fixed cost.
Correct Answer:

Verified
Correct Answer:
Verified
Related Questions
Q77: The variable cost ratio<br>A)expresses variable costs as
Q78: On a profit-volume graph, the _ line
Q79: The Solemn Company has an operating leverage
Q80: Which of the following assumptions is NOT
Q81: The following data pertain to the
Q83: Nonesuch Company sells only one product at
Q84: Biscuit Company sells its product for $50.
Q85: Biscuit Company sells its product for $50.
Q86: Increases in sales of low contribution margin
Q87: When a company sells more units than