Multiple Choice
The following diagram is a cost-volume-profit graph for a manufacturing company: 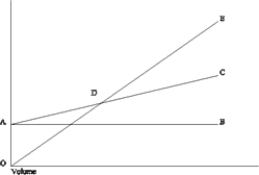
The formula to determine the Y-axis value ($) at point D on the graph is
A) Fixed costs + (Variable costs per unit × Number of units) .
B) ΣXY − bΣX.
C) Fixed costs/Unit contribution margin.
D) Fixed costs/Contribution margin ratio.
Correct Answer:

Verified
Correct Answer:
Verified
Q2: Which of the following assumptions does NOT
Q36: The DesMaris Company had the following
Q37: The Cumberland Company provides the following
Q38: The _ ratio expresses variable costs in
Q39: Jamie Quinn, a sole proprietor, has
Q41: The income statement for Symbiosis Manufacturing
Q43: Multiple-product break-even analysis requires a constant sales
Q44: The point of zero profit is called
Q45: The income statement for Symbiosis Manufacturing
Q53: Using cost-volume-profit analysis, we can conclude that