Multiple Choice
Finish times (to the nearest hour) for 59 dogsled teams are shown below. Draw a relative - frequency histogram. Use five classes. The frequency table for the above data is given below.
A) 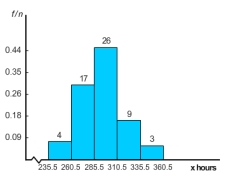
B) 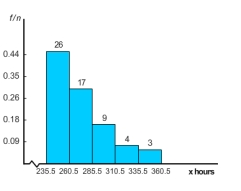
C) 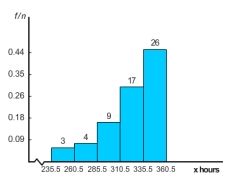
D) 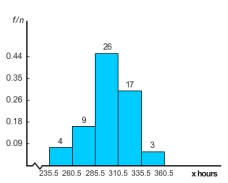
E) 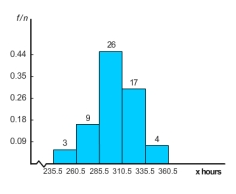
Correct Answer:

Verified
Correct Answer:
Verified
Related Questions
Q4: Finish times (to the nearest hour)
Q5: Use the data given in the
Q6: Assume that the following data represent
Q7: It's not an easy life, but it's
Q8: Finish times (to the nearest hour)
Q10: Finish times (to the nearest hour)
Q11: Finish times (to the nearest hour)
Q12: At Westgate Community College, a survey was
Q13: Assume that the following data represent
Q14: Wetlands offer a diversity of benefits.