Multiple Choice
Assume that the following data represent baseball batting averages (multiplied by 1000) for a random sample of National League players near the end of the baseball season. The frequency table showing class limits, class boundaries, midpoints and frequency is given below. Draw a histogram.
A) 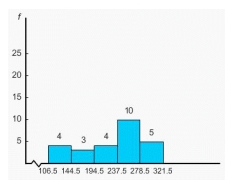
B) 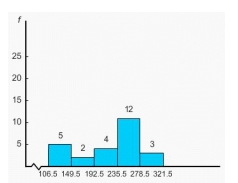
C) 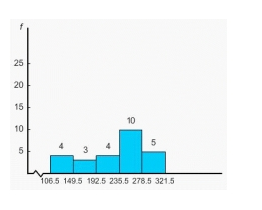
D) 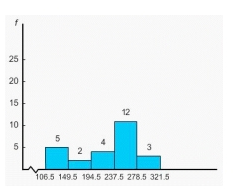
E)
Correct Answer:

Verified
Correct Answer:
Verified
Q11: Finish times (to the nearest hour)
Q12: At Westgate Community College, a survey was
Q13: Assume that the following data represent
Q14: Wetlands offer a diversity of benefits.
Q15: Finish times (to the nearest hour)
Q17: Finish times (to the nearest hour)
Q18: Finish times (to the nearest hour)
Q19: Assume that the U.S Open Golf
Q20: How long did real cowboys live?
Q21: Suppose the American Medical Association Center