Multiple Choice
Figure: Supply and Demand 1 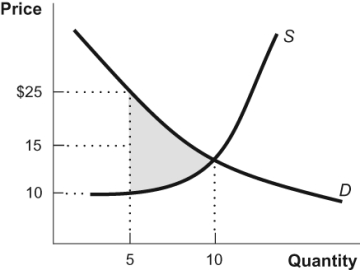 At a market quantity of 5, the shaded region in the figure represents:
A) satisfied wants.
B) unexploited gains from trade.
C) the value of wasted resources.
D) willingness to pay.
Correct Answer:

Verified
Correct Answer:
Verified
Q20: Economic growth in China has led to
Q65: Use the following to answer questions:<br>Figure: Price
Q66: Use the following to answer questions:<br>Figure: Demand,
Q67: Use the following to answer questions:<br>Figure: Price
Q98: The government must subsidize firms to ensure
Q118: Imagine a free market in equilibrium. After
Q172: The growing economies of China and India
Q193: Use the following to answer questions:<br>Figure: Market
Q246: Figure: Price and Quantity 4 <img src="https://d2lvgg3v3hfg70.cloudfront.net/TB3378/.jpg"
Q247: Use the following to answer questions: