Multiple Choice
Figure: Demand-Driven Price Change 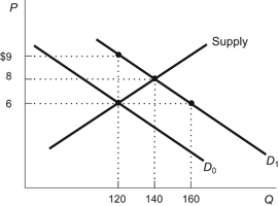 Refer to the figure. When the demand curve shifts from D0 to D1, the equilibrium price rises to:
A) $9 and the equilibrium quantity rises to 120.
B) $9 and the equilibrium quantity rises to 160.
C) $8 and the equilibrium quantity rises to 140.
D) $8 and the equilibrium quantity rises to 160.
Correct Answer:

Verified
Correct Answer:
Verified
Q3: Higher gasoline prices have led to a
Q16: Technological advances have increased the supply of
Q21: Use the following to answer questions:
Q83: An increase in supply causes a temporary
Q84: When the market price is above the
Q92: A market can be described by the
Q104: In free markets, shortages lead to:<br>A) lower
Q138: A market can be described by the
Q147: An increase in demand and a decrease
Q168: When demand increases there is a _