Multiple Choice
Figure: Supply-Driven Price Change 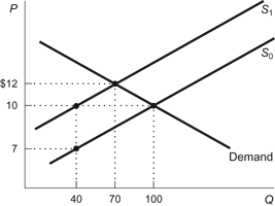 Refer to the figure. When the supply curve shifts from S0 to S1, the equilibrium price rises to:
A) $12 and the equilibrium quantity falls to 70.
B) $10 and the equilibrium quantity falls to 100.
C) $12 and the equilibrium quantity falls to 40.
D) $10 and the equilibrium quantity falls to 70.
Correct Answer:

Verified
Correct Answer:
Verified
Q32: The United Nations estimates that Earth's population
Q39: In a competitive market, buyers compete with
Q40: After a hurricane in Florida destroys half
Q58: Imagine a free market in which quantity
Q176: When the price of a good increases,
Q209: Five new sellers enter a market (that
Q212: An increase in the demand for organic
Q239: Which of the following is a contribution
Q242: A shortage occurs when consumers want to
Q250: A technological innovation in the production of