Multiple Choice
Figure: Demand Shift 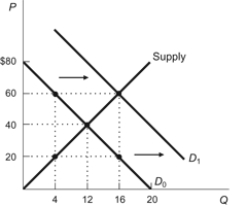 In the figure, the demand curve shifted from D0 to D1. To describe this movement, we would say that:
A) demand increased, which caused an increase in supply.
B) quantity demanded increased, which caused an increase in supply.
C) demand increased, which caused an increase in quantity supplied.
D) quantity demanded increased, which caused an increase in quantity supplied.
Correct Answer:

Verified
Correct Answer:
Verified
Q33: A demand curve shows the relationship between:<br>A)
Q34: The formation of the Organization of the
Q73: Why is consuming a quantity above equilibrium
Q77: The yearly shortage of Super Bowl tickets
Q102: If market demand decreases:<br>A) equilibrium price and
Q127: If supply increases, ceteris paribus, the quantity
Q137: A market can be described by the
Q153: Figure: Four Panel 2 <img src="https://d2lvgg3v3hfg70.cloudfront.net/TB3378/.jpg" alt="Figure:
Q231: Tim values treats for his dog at
Q251: In a free market, the market moves