Multiple Choice
Figure: Supply Shift 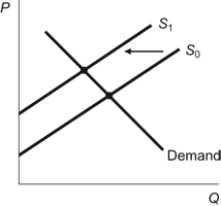 In the figure, the supply curve shifted from S0 to S1. To describe this movement, we would say that:
A) demand decreased, which caused a decrease in supply.
B) supply decreased, which caused a decrease in quantity demanded.
C) supply decreased, which caused a decrease in demand.
D) supply increased, which caused a decrease in quantity demanded.
Correct Answer:

Verified
Correct Answer:
Verified
Q14: Imagine a free market in which quantity
Q45: A market can be described by the
Q47: When Asian countries went into a recession
Q124: A free market can be described by
Q129: Use the following to answer questions:<br>Figure: Gains
Q199: In a free market equilibrium, prices and
Q210: After adjusting for inflation, a comparison of
Q221: Vernon Smith, Nobel Prize-winning economist, revolutionized economics
Q246: Imagine a free market in which at
Q254: In a market diagram, demand and supply