Multiple Choice
Use the following to answer question 63:
Figure: Production Function 1 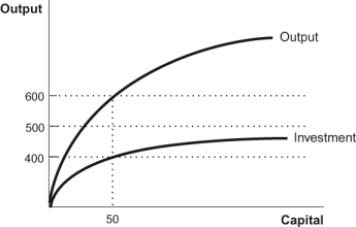
-(Figure: Production Function 1) Refer to the figure. In this diagram of the Solow model, if output is 600, consumption equals:
A) 50.
B) 200.
C) 400.
D) 600.
Correct Answer:

Verified
Correct Answer:
Verified
Related Questions
Q13: Which should lead to an increased rate
Q38: The Solow model predicts that a country
Q76: In 2010,China's GDP per capita grew by
Q111: Imagine an economy with production function
Q112: Which statement is NOT a reason for
Q117: In the Solow model with constant technological
Q118: Ideas are not rivalrous, meaning that:<br>A) many
Q118: Cutting-edge growth occurs primarily through capital accumulation
Q149: Which statement is consistent with the predictions
Q150: The key to escaping the "iron logic"