Multiple Choice
(Figure: Three Aggregate Demand Curves)
Figure: Three Aggregate Demand Curves 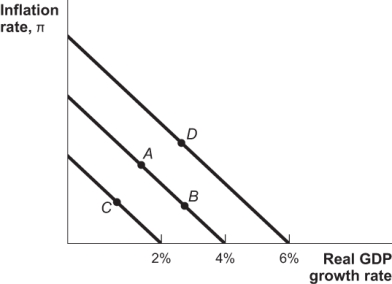
Consider the three aggregate demand curves shown in the graph. Movement from Point A to Point D represents:
A) an increase in spending growth from 2% to 3%.
B) an increase in spending growth from 4% to 6%.
C) an increase in real GDP growth, but not spending growth.
D) an increase in inflation, but not spending growth.
Correct Answer:

Verified
Correct Answer:
Verified
Q65: If spending grows by 3% while real
Q68: An increase in spending growth will cause
Q76: In a typical year,good shocks outweigh bad
Q82: Nominal wage confusion occurs when:<br>A) workers respond
Q87: The long-run aggregate supply curve describes an
Q88: A real shock is a rapid change
Q114: Which of the following factors would NOT
Q131: Which of the following causes the AD
Q158: The Black Plague is an example of
Q278: Why have oil shocks become less economically