Multiple Choice
Use the following to answer questions
Figure: Long-Run Aggregate Supply Curves 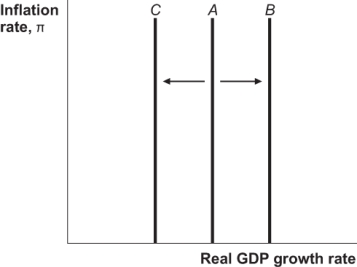
-(Figure: Long-Run Aggregate Supply Curves) Which of the following can explain the shift of the long-run aggregate supply curve from A to B in the figure?
A) development of new technology
B) war
C) negative supply shock
D) oil crisis
Correct Answer:

Verified
Correct Answer:
Verified
Q37: Which of the following is an explanation
Q38: Money is neutral in both the short
Q39: For a given aggregate demand curve,the specified
Q40: An increase in expected inflation will cause
Q41: If <span class="ql-formula" data-value="\vec {
Q43: Which of the following contributed to the
Q44: The economy's aggregate demand curve shows all
Q45: The short-run aggregate supply curve is upward-sloping
Q46: If the growth rate of the money
Q47: An increase in the growth rate of