Multiple Choice
Use the following to answer questions
Figure: Long-Run Aggregate Supply Curves 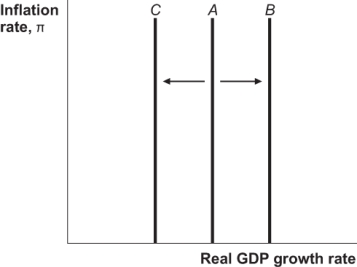
-(Figure: Long-Run Aggregate Supply Curves) Which of the following can explain the shift of the long-run aggregate supply curve from A to C in the figure?
A) development of new technology
B) an increase in the nation's factors of production
C) negative supply shock
D) increase in oil supply
Correct Answer:

Verified
Correct Answer:
Verified
Q61: In the AD-AS model,both real and demand
Q62: During a recession:<br>A) labor is not fully
Q63: The position of the long-run aggregate supply
Q64: The aggregate demand curve shows the relationship
Q65: If spending grows by 3% while real
Q67: The unemployment rate decreases during a recession.
Q68: An increase in spending growth will cause
Q69: An increase in the rate of spending
Q70: In the AD-AS model with SRAS included,prices
Q71: Discuss the effects of an unexpected increase