Multiple Choice
Use the following to answer questions: Figure Real Shocks 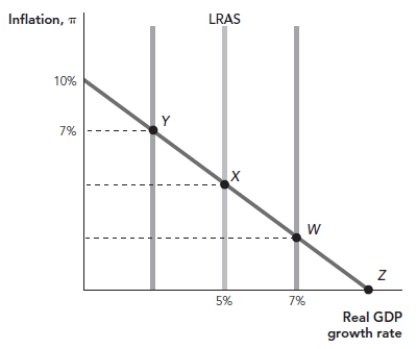
-(Figure: Real Shocks) From Point X in the accompanying graph, a negative supply shock could change the inflation rate to:
A) 3%.
B) 7%.
C) 5%.
D) 10%.
Correct Answer:

Verified
Correct Answer:
Verified
Related Questions
Q27: If stock prices go up and people
Q34: The AD-AS model consists of the:<br>A) aggregate
Q120: Using a graph of the AD and
Q143: Compare two economies,one that is highly agricultural
Q160: Other things held constant,an increase in the
Q167: A reduction in the supply of oil
Q168: Which of the following is an example
Q170: The short-run aggregate supply curve shows the
Q181: Productivity shocks were the primary cause of
Q206: Which of the following would NOT shift