Multiple Choice
Use the following to answer questions: Figure: Oil Market Diagrams 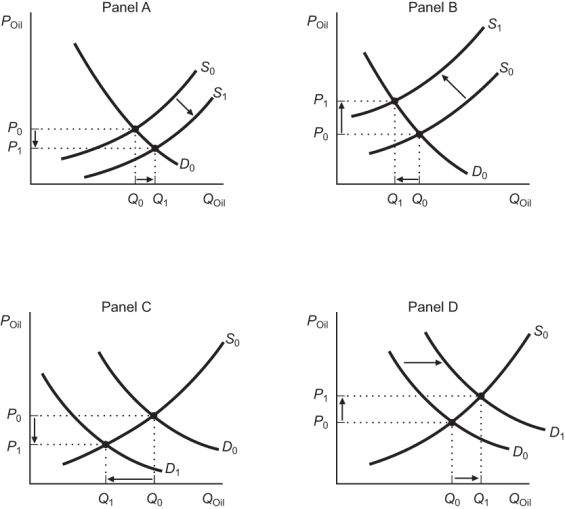
-(Figure: Oil Market Diagrams) Consider the world oil market diagrams presented in the figure. Which of the panels correctly depicts what happened in the market for oil during the 1973 OPEC oil crisis?
A) Panel A
B) Panel B
C) Panel C
D) Panel D
Correct Answer:

Verified
Correct Answer:
Verified
Q36: In 2011, the major earthquake and tsunami
Q37: If <span class="ql-formula" data-value="\bar {
Q42: The main reason(s) for the slope of
Q51: Which of the following explains why the
Q90: A decrease in the supply of oil
Q128: The slope of the aggregate demand curve
Q175: The long-run aggregate supply curve shows that
Q189: An increase in expected inflation will cause
Q204: The aggregate demand curve is a straight
Q228: The primary purpose of the AD-AS model