Multiple Choice
Use the following to answer questions: Figure: Oil Market Diagrams 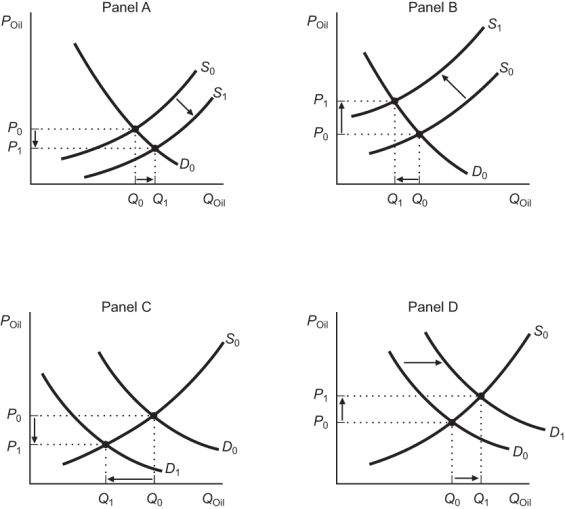
-(Figure: Oil Market Diagrams) Consider the world oil market diagrams presented in the figure. Which of the panels correctly depicts the cause of rises in the price of oil in the early 2000s?
A) Panel A
B) Panel B
C) Panel C
D) Panel D
Correct Answer:

Verified
Correct Answer:
Verified
Q22: An unexpected increase in money growth increases
Q52: The aggregate demand curve shows all the
Q54: The aggregate demand curve has a slope
Q58: A negative real shock causes:<br>A) a lower
Q81: The term "stagflation" was used to describe
Q93: A negative real shock causes the long-run
Q99: Money will not be neutral in the
Q155: In the AD-AS model, <span
Q161: High oil prices tend to:<br>A) increase the
Q162: The long-run aggregate supply curve shows that