Multiple Choice
Use the following to answer questions:
Figure: Supply and Demand 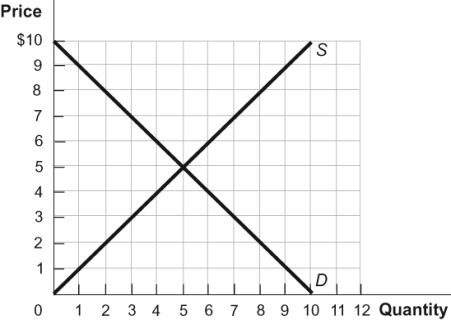
-(Figure: Supply and Demand) At the equilibrium price in the figure, the unsatisfied demanders are represented by the section of the demand curve between:
A) $5 and $10.
B) $0 and $5.
C) $3 and $7.
D) $0 and $10.
Correct Answer:

Verified
Correct Answer:
Verified
Q86: Failing to understand the signaling role of
Q87: Markets are linked in unpredictable and creative
Q88: Which factor(s) contribute to the increased speed
Q89: Two centrally planned economies in 2011 were:<br>A)
Q90: Suppose that everyone believes war is about
Q92: In a free market, the price of
Q93: On average, the gain in value from
Q94: If more sugar cane is demanded for
Q95: The United States is the world's largest
Q96: Which scenario would cause a speculator to