Multiple Choice
Figure: Price Changes 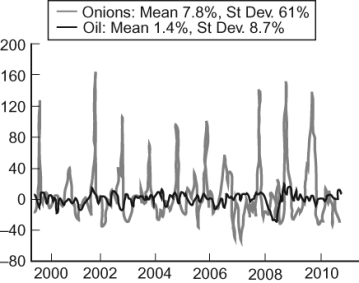 The figure (from Global Financial Data, EIA) illustrates in percentage terms how the price of onions (in gray) and crude oil (in black) fluctuate over time. The price of onions clearly fluctuates more than oil. In 1958, the United States Congress banned future markets on onions. How does this historical fact explain the difference in deviation between oil and onions?
A) The ban prevented analysts from buying and selling based on the price of onions' current supply and demand.
B) The ban encouraged speculation on the onion, causing its price to fluctuate widely as different bubbles grew and popped.
C) The ban destroyed any incentive for market participants to understand the onion industry.
D) The ban forced market participants to buy and sell based solely on current supply and demand.
Correct Answer:

Verified
Correct Answer:
Verified
Q19: An increase in the futures price of
Q47: Recall from the text that weather is
Q58: If the value of a heap of
Q103: People use futures contracts to:<br>A) increase prices.<br>B)
Q190: The advantages of prediction markets include:<br>A) the
Q198: Which statement explains why many economists have
Q240: It is in consumers' self-interest to pay
Q241: Firms that fail to compete with lower
Q248: The great economic problem is to:<br>A) increase
Q272: Legalizing insider trading may have some advantages