Multiple Choice
Figure: Demand 1 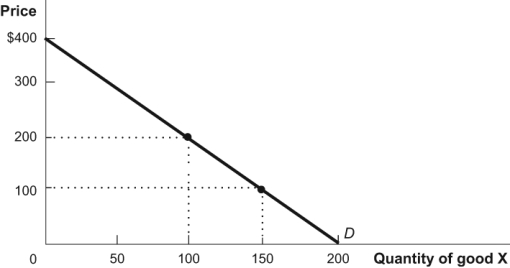 In the diagram, what is the elasticity of demand between a price of $100 and $200? Use the midpoint method of calculation to find your answer.
A) -1.8.
B) -0.9.
C) -0.6.
D) -0.2.
Correct Answer:

Verified
Correct Answer:
Verified
Related Questions
Q8: If the demand for currently illegal recreational
Q25: The elasticity of supply measures how sensitive
Q105: Since roughly 1950, total revenues in the
Q120: When demand is inelastic, total revenue goes
Q138: The demand for Michelin tires is _
Q162: If the price of Good Y falls
Q163: Why is the war on drugs hard
Q164: Figure: Price Increase and Elasticity <img src="https://d2lvgg3v3hfg70.cloudfront.net/TB33781/.jpg"
Q165: If the price of coffee falls by
Q209: When a shift in demand or supply