Multiple Choice
Use the following to answer questions:
Figure: Demand 1 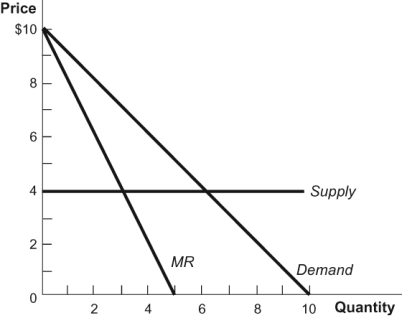
-(Figure: Demand 1) A cartel facing the market in this diagram would try to cause industry output to:
A) increase from 5 to 10.
B) increase from 3 to 6.
C) decrease from 6 to 3.
D) decrease from 5 to 2.
Correct Answer:

Verified
Correct Answer:
Verified
Related Questions
Q6: Cheaters in cartels make _ profit when
Q7: What are three reasons that cartels collapse?
Q8: Game theory is the study of independent
Q9: A 2006 paper by Margeret Levenstein and
Q10: How can the pursuit of market power
Q12: All cartels and cartel-like behavior are illegal
Q13: Which of the following is NOT a
Q14: Which of the following explains why the
Q15: Copper is a natural resource. Why is
Q16: The National Basketball Association is a:<br>A) natural