Multiple Choice
Exhibit 5-8 Supply and demand curves for good X
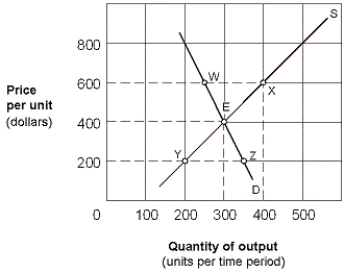
-As shown in Exhibit 5-8, the price elasticity of supply for good X between points E and X is:
A) 1/5 = 0.20.
B) 1/11 = 0.91.
C) 1/2 = 0.50.
D) 5/11 = 0.45.
Correct Answer:

Verified
Correct Answer:
Verified
Related Questions
Q24: Along the elastic range of a demand
Q32: If automobiles and gasoline are complements, then
Q98: A study of consumers in an area
Q226: Exhibit 5-8 Supply and demand curves for
Q227: If the supply of a good is
Q228: If a tripling of price triples the
Q230: We would expect the cross elasticity between
Q232: If an increase in the price of
Q233: If the short-run price elasticity of demand
Q235: It is Valentine's Day and Jason is