Multiple Choice
Exhibit 5-8 Supply and demand curves for good X
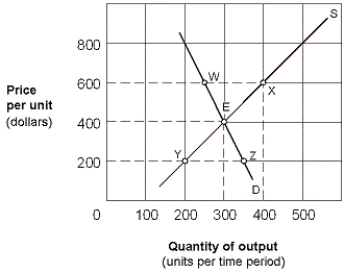
-In Exhibit 5-8, the price elasticity of supply for good X between points E and X is:
A) 7/5 = 1.40.
B) 1/5 = 0.20.
C) 5/7 = 0.71.
D) 1.
Correct Answer:

Verified
Correct Answer:
Verified
Related Questions
Q16: If the percentage change in the quantity
Q52: Using the midpoints formula, what would be
Q70: Using supply and demand analysis, which of
Q123: A lower price elasticity of demand coefficient
Q151: If the demand curve for a good
Q154: If a 10 percent price increase causes
Q155: As shown in Exhibit 3-10, assume the
Q158: To raise the most tax revenue, governments
Q159: Which of the following pairs is most
Q161: A product would be more demand price