Multiple Choice
Exhibit 5-9 Supply and demand curves for good X
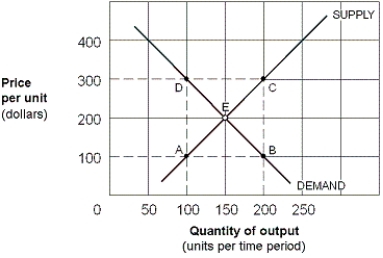
-As shown in Exhibit 5-9, the price elasticity of demand for good X between points E and D is:
A) 1/5 = 0.20.
B) 3/7 = 0.43.
C) 1/2 = 0.50.
D) 1.
Correct Answer:

Verified
Correct Answer:
Verified
Related Questions
Q251: Which of the following pairs is most
Q252: As the economy recovers from a recession,
Q253: A product would be more demand price
Q254: The number of computers bought increased by
Q255: If the managers of the bus system
Q257: Price elasticity of demand is defined as
Q258: Exhibit 5-9 Supply and demand curves for
Q259: Exhibit 5-2 Price and quantity demanded
Q260: If demand for a good is price
Q261: If a straight-line demand curve slopes down,