Multiple Choice
Exhibit 5-9 Supply and demand curves for good X
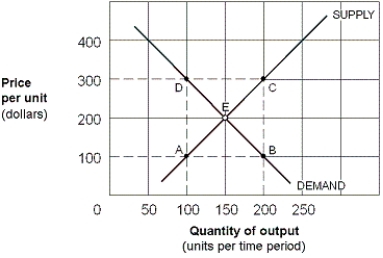
-As shown in Exhibit 5-9, assuming good X is a normal good, an increase in consumer income, other factors held constant, could move the equilibrium from point E to point:
A) A.
B) B.
C) C.
D) D.
Correct Answer:

Verified
Correct Answer:
Verified
Related Questions
Q112: As cities prospered and per-capita incomes increased,
Q217: Leo's Bakery reduces the price of wheat
Q218: Price elasticity of demand refers to the:<br>A)
Q220: If demand is inelastic, an increase in
Q221: In response to a price change for
Q223: An inferior good is:<br>A) any good of
Q224: When the government imposes a tax, sellers
Q225: If the income elasticity of demand for
Q226: Exhibit 5-8 Supply and demand curves for
Q227: If the supply of a good is