Multiple Choice
Exhibit 5-9 Supply and demand curves for good X
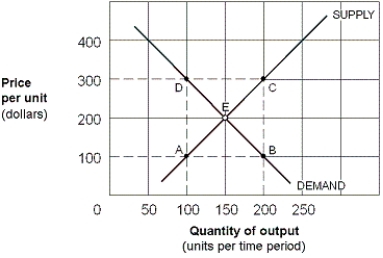
-As shown in Exhibit 5-9, assuming good X is an inferior good, an increase in consumer income, other factors held constant, could move the equilibrium from point E to point:
A) A.
B) B.
C) C.
D) D.
Correct Answer:

Verified
Correct Answer:
Verified
Q23: If the price elasticity of demand for
Q24: Exhibit 5-1 Demand curve<br> <img src="https://d2lvgg3v3hfg70.cloudfront.net/TB6121m/.jpg" alt="Exhibit
Q25: If a consumer's purchases of a product
Q28: Elasticity measures how "sensitive" consumers are by
Q29: Exhibit 5-6 Demand curve for concert tickets<br>
Q32: The short-run price elasticity of demand for
Q114: Sally recently got a 15 percent raise.
Q117: If the price elasticity of demand coefficient
Q128: Suppose the quantity demanded is 1,000 million
Q131: A perfectly elastic supply curve is expressed