Multiple Choice
Exhibit 5-9 Supply and demand curves for good X
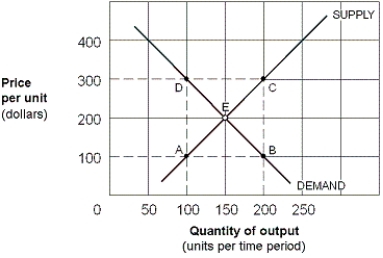
-In Exhibit 5-9, the price elasticity of supply for good X between points A and E is:
A) 3/5 = 0.60.
B) 5/3 = 1.66.
C) 1/2 = 0.50.
D) 1.
Correct Answer:

Verified
Correct Answer:
Verified
Related Questions
Q134: If the quantity of bread demanded rises
Q135: Suppose that when price is $10, quantity
Q136: The responsiveness of suppliers to changing prices
Q137: If demand for a good is price
Q138: If New York City expects that an
Q141: Suppose the Pleasant Corporation cuts the price
Q142: Exhibit 5-9 Supply and demand curves for
Q143: A measure of sensitivity or responsiveness to
Q144: If an increase in the price of
Q169: If the demand for cigarettes is highly