Multiple Choice
Exhibit 4-3 Supply and demand curves 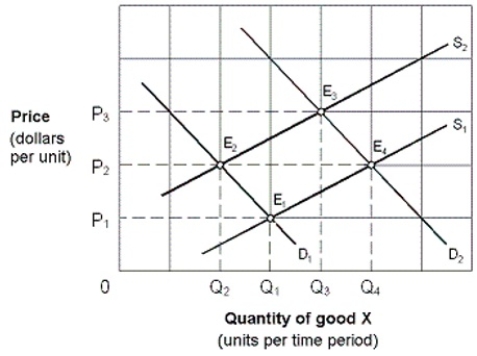
-Initially the market shown in Exhibit 4-3 is in equilibrium at P3, Q3 (E3) . Changes in market conditions result in a new equilibrium at P2, Q2 (E2) . This change is stated as a:
A) decrease in demand and an increase in supply.
B) decrease in demand and a decrease in quantity supplied.
C) decrease in quantity demanded and an increase in quantity supplied.
D) decrease in quantity demanded and an increase in supply.
Correct Answer:

Verified
Correct Answer:
Verified
Q11: Cindy discovers that when she goes to
Q26: Suppose prices for new homes have risen,
Q130: If we observe a decrease in the
Q157: Assume a price floor is set
Q158: Suppose a wallet firm has been dumping
Q160: The reason individual homeowners usually do not
Q161: Which of the following would be an
Q163: Examples of market failure include lack of
Q164: A price ceiling:<br>A) is the lowest price
Q167: Exhibit 4-3 Supply and demand curves <img