Multiple Choice
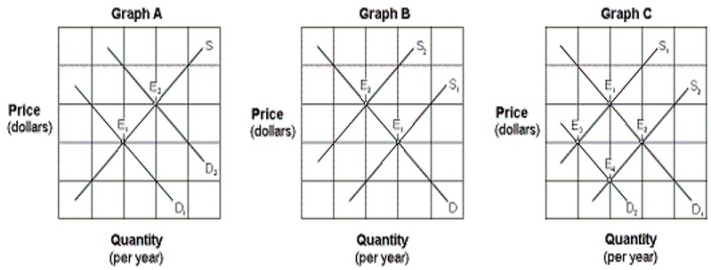
Exhibit 4-4 Supply and demand curves for good X 
-An increase in the wage rate paid to workers producing good X would be represented by which of the graphs in Exhibit 4-4?
A) Graph A.
B) Graph B.
C) Graph C.
D) None of these.
Correct Answer:

Verified
Correct Answer:
Verified
Related Questions
Q56: If the equilibrium price of good X
Q79: Assume a ceiling price is set above
Q80: Unintended costs that are imposed in third
Q81: Albert and Betty hire Christine and David
Q82: Ceteris paribus, if consumer tastes change so
Q85: Exhibit 4-2 Supply and demand curves <img
Q86: The city of Logan Square needs $40
Q87: Higher gasoline prices would likely raise the
Q88: Exhibit 4-10 Supply and demand data
Q89: If a price ceiling is imposed, then:<br>A)