Multiple Choice
Exhibit 4-4 Supply and demand curves for good X 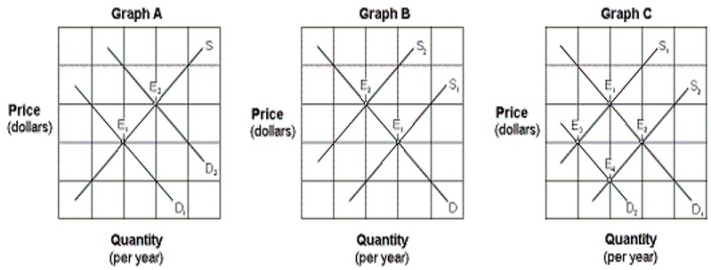
-Which of the graphs in Exhibit 4-4 represents a decrease in the price of a factor of production?
A) Graph A.
B) Graph B.
C) Graph C.
D) None of these.
Correct Answer:

Verified
Correct Answer:
Verified
Related Questions
Q210: If consumers switch away from eating margarine
Q211: Which of the following is not an
Q212: Rent controls create distortions in the housing
Q213: Exhibit 4-2 Supply and demand curves <img
Q214: Which of the following is a public
Q216: Which of the following is a public
Q217: A public good is any good or
Q218: Assuming supply is held constant, an increase
Q219: Exhibit 4-3 Supply and demand curves <img
Q220: A hurricane destroyed the peach crop in