Multiple Choice
Exhibit 4-8 Demand and supply curves
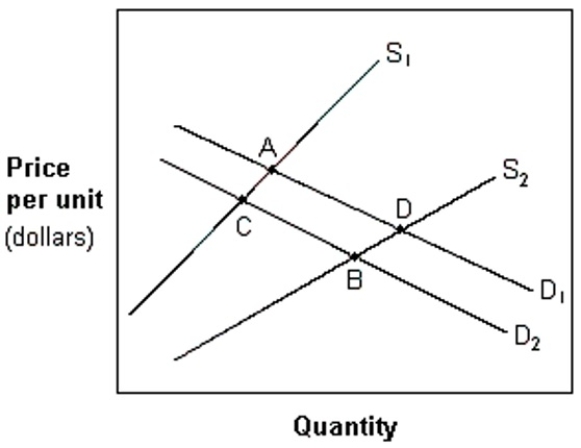
-In Exhibit 4-8, a movement from A to C is best described as a(n) :
A) increase in the quantity supplied and an increase in the demand.
B) decrease in the quantity supplied and a decrease in demand.
C) decrease in the quantity supplied and an increase in demand.
D) decrease in the quantity demanded and a decrease in supply.
E) decrease in both quantity demanded and quantity supplied.
Correct Answer:

Verified
Correct Answer:
Verified
Q116: Exhibit 4-8 Demand and supply curves<br> <img
Q117: If the equilibrium price of aspirins is
Q118: Which of the following is an example
Q119: From the standpoint of economic efficiency, competitive
Q120: Exhibit 4-9 Data on supply and
Q122: Exhibit 4-5 Supply and demand curves for
Q123: One method of correcting for _ externalities
Q124: Denise is thinking about setting up a
Q125: Exhibit 4-7 Demand and supply schedules
Q126: Which if the following is the best