Multiple Choice
Exhibit 3-3 Demand curves 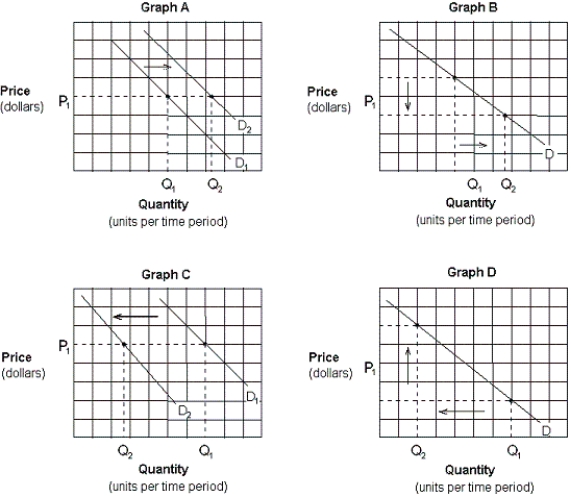
-Which of the graphs in Exhibit 3-3 depicts the effect of a decrease in the price of domestic cars on the demand for foreign cars?
A) Graph A.
B) Graph B.
C) Graph C.
D) Graph D.
Correct Answer:

Verified
Correct Answer:
Verified
Related Questions
Q33: The deadweight loss equals the consumer surplus
Q34: Assuming steak and potatoes are complements, other
Q35: A leftward shift of a supply curve
Q37: Which of the following pairs of goods
Q39: Suppose that X and Y are complementary
Q40: If the price of coffee decreases, the
Q41: Exhibit 3-8 Demand and supply data
Q42: Suppose that X and Y are substitute
Q43: If more people enter medical school, we
Q112: Other things being equal, the effects of