Multiple Choice
Exhibit 3-3 Demand curves 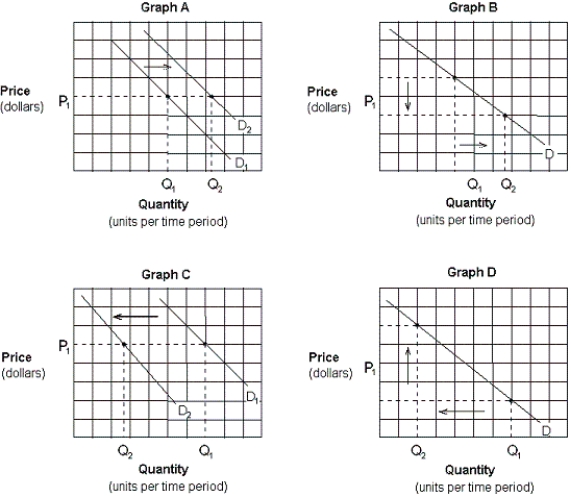
-Assume that crackers and soup are complementary goods. Which of the graphs in Exhibit 3-3 depicts the effect of a promotional discount that decreases the price of crackers on the demand for soup?
A) Graph A.
B) Graph B.
C) Graph C.
D) Graph D.
Correct Answer:

Verified
Correct Answer:
Verified
Q74: When there is a surplus of a
Q274: Exhibit 3-14 Supply and demand curves <img
Q275: If people expect the price of packaged
Q276: Coffee and tea are:<br>A) complements.<br>B) substitutes.<br>C) inferior
Q277: At a price of $5, Sam buys
Q278: Tasha decides that when homes in her
Q280: A movement along a demand curve is
Q281: Which of the following will not cause
Q282: Which of the following situations results from
Q283: Exhibit 3A-2 Comparison of Market Efficiency and