Multiple Choice
Exhibit 3-3 Demand curves 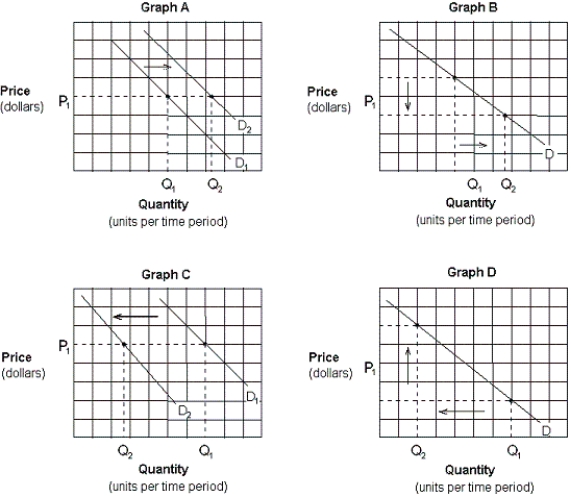
-Which of the graphs in Exhibit 3-3 depicts the effect of an increase in income on the demand for pork and beans (an inferior good) ?
A) Graph A.
B) Graph B.
C) Graph C.
D) Graph D.
Correct Answer:

Verified
Correct Answer:
Verified
Related Questions
Q18: In accordance with the law of supply,
Q77: Which of the following is most likely
Q117: Suppose Jones sells a good for $100
Q145: Which of the following pairs is the
Q146: Producer surplus:<br>A) measures the value between the
Q147: Suppose A and B are complementary goods.
Q150: A change in demand cannot be caused
Q152: Two goods that are substitutes are:<br>A) bacon
Q153: If the price of good X increases
Q164: A movement along the demand curve for