Multiple Choice
Exhibit 3A-1 Comparison of Market Efficiency and Deadweight Loss 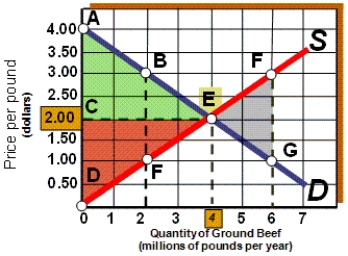
-As shown in Exhibit 3A-1, if the quantity supplied is 2 million pounds of ground beef per year, the result is a deadweight loss represented by area:
A) ABEC.
B) CEFD.
C) EGH.
D) BEF.
Correct Answer:

Verified
Correct Answer:
Verified
Q67: Assuming that bus travel is an inferior
Q378: Which of the following is true about
Q379: Which of the following is closest to
Q380: Exhibit 3A-1 Comparison of Market Efficiency and
Q381: A rightward shift in the demand curve
Q382: A supply curve:<br>A) has a negative slope.<br>B)
Q385: Assuming gasoline and oil to be complementary
Q386: Exhibit 3A-1 Comparison of Market Efficiency and
Q387: The law of supply states that an
Q388: Exhibit 3-4 Supply curves <img src="https://d2lvgg3v3hfg70.cloudfront.net/TB6121m/.jpg" alt="Exhibit