Multiple Choice
Exhibit 1A-10 Multi-curve graph 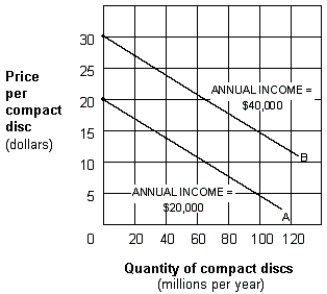
-Exhibit 1A-10 represents a three-variable relationship. As the annual income of consumers rises from $20,000 (line A) to $40,000 (line B) , the result is a:
A) rightward movement along each curve.
B) leftward movement along each curve.
C) leftward shift in curve B to curve A.
D) leftward shift in curve A to curve B.
Correct Answer:

Verified
Correct Answer:
Verified
Q91: Assume there is a relationship between
Q160: Graphically express a direct and an inverse
Q222: Exhibit 1A-5 Straight line <img src="https://d2lvgg3v3hfg70.cloudfront.net/TB6121m/.jpg" alt="Exhibit
Q223: The perpetual state of insufficiency of resources
Q224: Normative economics is:<br>A) usually incorrect.<br>B) a statement
Q225: Economic models are of limited use since
Q227: The most fundamental concepts underlying the discipline
Q228: A line that has a different slope
Q229: Which of the following is not a
Q231: Which of the following is a positive