Essay
Assume that that the two graphs below are identical demand curves for hamburger. The only difference is that the one on the left measures hamburger in pounds and the one on the right measures hamburger in ounces. The elasticity of demand between the prices of $3 and $2 should be the same in both cases. However, prove that calculating the slopes between these two points on each graph would not be helpful in determining elasticity of demand. 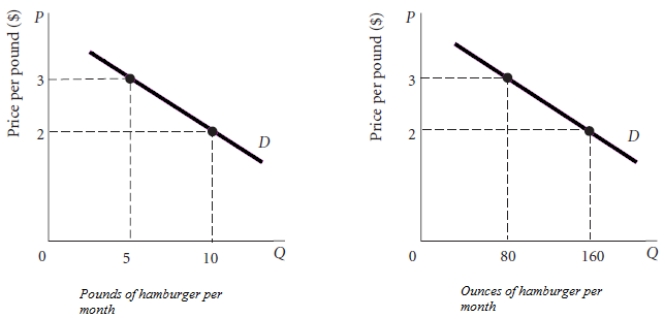
Correct Answer:

Verified
Slope is calculated by taking ...View Answer
Unlock this answer now
Get Access to more Verified Answers free of charge
Correct Answer:
Verified
View Answer
Unlock this answer now
Get Access to more Verified Answers free of charge
Q47: Would you expect the income elasticity of
Q48: Suppose that the price elasticity of demand
Q49: Suppose that the price elasticity of demand
Q50: The recent reduction in the price of
Q51: Refer to Scenario 2. Over a long
Q53: In the past dating was a fairly
Q54: If the elasticity of demand were positive
Q55: If leisure is a normal good and
Q56: Even though airfares have been increasing, the
Q57: Suppose a movie theater raises its ticket