Essay
Refer to the information provided in Scenario 1 below to answer the following questions.
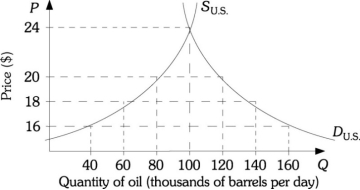
SCENARIO 1: The following diagram represents the U.S. market for oil. 
-Refer to Scenario 1. Use the midpoint formula to calculate the price elasticity of demand between $18 and $16.
Correct Answer:

Verified
Correct Answer:
Verified
Related Questions
Q1: The university you attend needs to increase
Q2: What is the midpoint formula for calculating
Q4: In the 1970s a typical college student's
Q5: Refer to the information provided in Scenario
Q6: Explain with the use of a graph
Q7: Comment on the following statement: "Elasticity is
Q8: If a good is income inelastic what
Q9: In the face of gasoline prices approaching
Q10: The demand for tobacco is price inelastic.
Q11: When Frank's income rises from $29,000 to